


An infographic is a powerful tool that can help explain something. Infographics present information visually and in an entertaining way. This can help watchers, listeners and readers understand the subject of interest.
You can use infographics on social media, in presentations or just for fun. BitRebels.com says the human brain absorbs ideas presented in infographics three times faster than ideas presented in simple text.
The easiest way to create infographics is to start with a template you can fill with facts. With most infographic templates, you can add images, icons and also backgrounds.
Infographic websites offer free templates and tools to help you create. Just pick the template you want, then drag and drop items onto the infographic.
Many of these sites let you add your own images from a computer. Type in text, choose fonts and colors, then save your infographic and/or share it on social media.
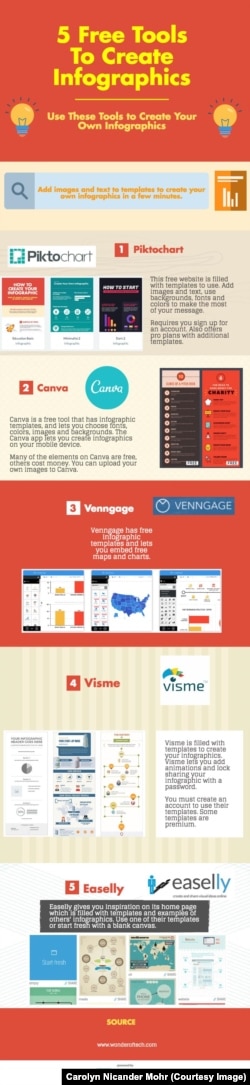
These sites make creating infographics easy and free.
Piktochart
Piktochart is a website filled with infographic, presentation, poster and report templates. Register for an account and get started by choosing an infographic template.
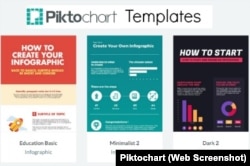
The free service gives a limited number of templates. Users can pay for more templates, and other help, such as the ability to save in PDF format.
Piktochart has a helpful infographics tips page to guide you through creating infographics.
An infographic on Piktochart shows free tools to create your own infographic.
Canva
Canva is a free design website to create infographics, social media cover images, invitations, posters, cards and more. Head to the site, register for an account and click Create a Design.
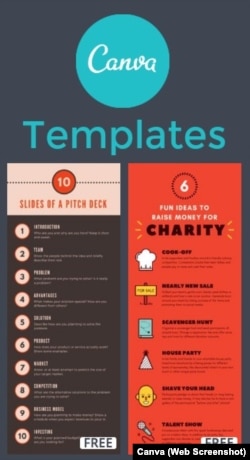
Choose Infographic to find free templates. After choosing one, add background designs, images, text, charts and more. Use Canva's free photos or upload your own.
Many of Canva's elements are free, though some cost about $1.
Canva also has a free app for iPhone and iPad to create infographics on the go: Canva app.
Venngage
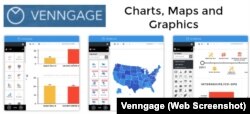
Venngage is another website that gives free tools to create infographics, reports, posters, and social media posts. Sign up for Venngage and choose which type of infographic you want to create, such as process, timeline, comparison or charts.
The templates are organized by level of difficulty: beginner, intermediate or advanced. Some of the templates are only available for sale. Venngage lets you include charts and their maps for free infographics.
Users can create up to five infographics with Venngage for free.
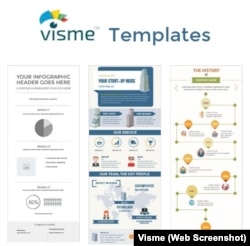
Visme
Visme lets you search for templates by keyword. Sign up for an account and search by format, such as comparison, or by subject, such as education. You can also view different templates to choose one that works best for you. Some of the templates are for sale only.
A video on YouTube shows how to use Visme:
A very interesting feature of Visme infographics is that you can animate parts of the design. For example, you can make text move in a wave.
Visme lets you create interactive maps you can use in the infographic. You can also add a YouTube video to your infographic. You can even add music to your infographic with free tunes from Visme.
When you are finished with your Visme infographic, you can keep it to yourself, publish it or lock it with a password you can share. You must pay to use the shared password service.
Visme lets you make up to three projects with a free account.
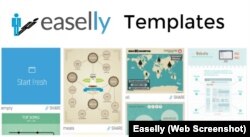
Easelly
Easelly has many free templates to use for infographics. Sign up for a free account and choose a template to get started.
Select a background and add text, shapes, charts and objects to your infographic. Add images from Easelly or upload your own. You can add a YouTube video into your infographic.
The video from Easelly shows how to create an infographic using their site:
I’m Dorothy Gundy. And I'm Bryan Lynn.
Carolyn Nicander Mohr wrote this report for VOA Learning English. Caty Weaver was the editor.
Have you ever wanted to make an infographic? Have you tried any of these infographic tools? Can you suggest any other tools to create infographics?
Share your thoughts in the Comments Section below or on our Facebook page.
________________________________________________________________
Words in This Story
infographic - n. a visual image such as a chart or diagram used to represent information or data
text - n. the original words of a piece of writing or a speech
template - n. a computer document that has the basic format of something (such as a business letter, chart, graph, etc.) and that can be used many different times
icon - n. a small picture on a computer screen that represents a program or function
item - n. an individual thing : a separate part or thing
font - n. a set of letters, numbers, and punctuation marks that are all one size and style
account - n. an arrangement in which a person uses the Internet or e-mail services of a particular company
chart - n. information in the form of a table, diagram, etc.
intermediate - adj. relating to or having the knowledge or skill of someone who is more advanced than a beginner but not yet an expert
advanced - adj. far along in a course of progress or development
animate - v. to make (something, such as a drawing) appear to move